Creating Pseudo-Gel Views
When dealing with large spectral databases which sometimes comprise hundreds of individual mass spectra, data inspection and data assessment cannot be done by manual screening of the individual spectra alone. In these instances simulated pseudo-gel views for visual analysis of the data set are popular means. In gel view representations, spectral peak intensities are converted to color or gray scales and plotted as a function of the m/z values. Gel views are usually generated from pre-processed and internally calibrated mass spectra.
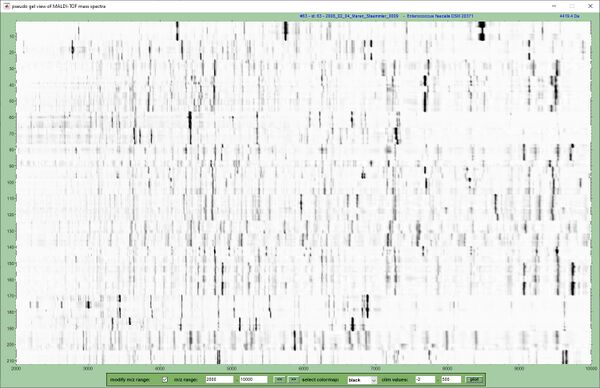
The pseudo-gel view below displays pre-processed experimental mass spectra from the an ESKAPE sample panel containing 212 MALDI-ToF mass spectra. The x-axis records the m/z values while the y-axis displays the running spectrum number. Log-scaled spectral intensities are expressed by a gray-scale code.
How to generate a pseudo-gel view?
1. Load the mass spectral data files via the load spectra (Bruker data file format), import spectra from mzXML data, or the load MS multifile options of the File pull down menu.
2. Perform spectral pre-processing
3. Select mass spectra to be displayed from the list box in the upper right corner of the main window of MicrobeMS (see screenshot MicrobeMS. Hold the shift key while selecting multiple spectra.
4. Select pseudo-gel view from the view pull down menu. Alternatively, press <ctrl><G>. A window entitled pseudo-gel view of MALDI-ToF mass spectra will come up.
5. To modify the m/z range check the checkbox edit mass range manually and enter the respective m/z range values in the edit fields mass range. Press then the button plot
6. The popup menu select color map allows to change the color map (the default color map is black)
7. To modify the contrast of the pseudo-gel view modify the respective values in edit fields clim values
8. The mouse over function of the gel view window shows the ID of the actual mass spectrum and the intensity - m/z pair (intensity of the pre-processed spectrum)
9. To export the gel view select capture gel view (jpg) or plot gel view (eps) from the context menu (right mouse button over the gel view)
