Wilcoxon Rank-Sum Test: Difference between revisions
Jump to navigation
Jump to search
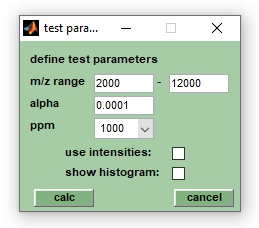
(Created page with "__FORCETOC__ == Introduction == right|input parameters for univariate t-tests| [https://en.wikipedia.org/wiki/Wilcoxon_signed-rank_test| Wilcoxon rank-sum test] (Wikipedia) To be continued == Parameter of the Wilcoxon rank-sum test == * m/z range: boundaries of the m/z region in which the Wilcoxon rank-sum tests are performed * α: significance level of the Wilcoxon rank-sum test * dx (ppm): a parameter defining the width and the number of...") |
(No difference)
|
Latest revision as of 11:32, 18 March 2023
Introduction

Wilcoxon rank-sum test (Wikipedia)
To be continued
Parameter of the Wilcoxon rank-sum test
- m/z range: boundaries of the m/z region in which the Wilcoxon rank-sum tests are performed
- α: significance level of the Wilcoxon rank-sum test
- dx (ppm): a parameter defining the width and the number of the m/z spectra segments. For example, a spectral segment centered at the position x covers a m/z interval of the width x * dx/10^6. The boundaries of the spectra segments are defined by [x*(1-dx/(2*10^6))] and [x*(1+dx/(2*10^6))], respectively. For values of x = 2000 (m/z) and dx = 1000, the width of the respectice segment is 2 and the m/z values of the boundaries are 1999 and 2001.
- intensity: defines if barcode spectra or peak weighting factors are utilized as test inputs.
- show histogram: provides a histogram of the test outputs (p-values, AUC, etc.) and gives also the mean, median and the standard deviation of the test variables.
Performing Wilcoxon rank-sum tests
1. Load the mass spectral data files via the load spectra (Bruker data file format),
   import spectra from mzXML data, or the load MS multifile options of the File
   pulldown menu.
2. Wilcoxon rank-sum tests are carried out from labeled spectra, i.e. from spectra with a class
   assignment. To perform the test label two groups of spectra as class 1 and as class 2, respectively.
   Labelling, or class assignment, can be carried out by selecting the appropriate spectra and choosing
   class assignments --> class X from the Edit pulldown menu.
3. The test routine always starts from original MALDI-TOF mass spectra, i.e. spectral pre-processing
   and peak detection is carried out automatically using pre-defined parameters. Existing
   pre-processed spectra and pre-defined peak tables are ignored by the Wilcoxon rank-sum tests.
4. Define test parameter, such as α (significance level), the m/z range and dx (ppm) which has a default
   value of 1000 (relative, in ppm). The parameter dx defines the width of m/z segments in which spectra
   are divided during the test. Peaks found in the same m/z segment are considered identical while
   mass peaks in different segments are considered different peaks.
5. When finished select peak frequency plots from the Analysis pulldown menu. Choose
   options from selection or from class X if the peak frequency test should involve selected
   spectra or spectra with an appropriate class labelling, respectively.
Output of Wilcoxon rank-sum test
Example of the output from a series of Wilcoxon rank-sum tests taken from the log file of MicrobeMS:
|
   peakstats(tsttyp,prm,class)
   tsttyp: wilcx
   prm   : 2
   class : 0
   ******************************************************
   * univariate Wilcoxon rank sum tests
   *   p-values
   ******************************************************

  number of spectra of class 1: 53
  number of spectra of class 2: 55
  start mass  : 2000 m/z
  end mass    : 12000 m/z
  alpha       : 0.0001
  allowed ppm : 1000
  use peak intensities [0(NO)/1(YES)]: 0

  #1, p-values  1.9335e-09 at m/z = 2518.0283
  #2, p-values  1.8206e-08 at m/z = 8035.9213
  #3, p-values  1.0022e-07 at m/z = 3876.8279
  #4, p-values  2.8756e-07 at m/z = 6772.547
  #5, p-values  5.2462e-07 at m/z = 6481.3235
  #6, p-values  4.5955e-06 at m/z = 6552.5802
  #7, p-values  1.1652e-05 at m/z = 3519.6031
  #8, p-values  1.1652e-05 at m/z = 3983.3741
  #9, p-values  2.3408e-05 at m/z = 2871.5769
  #10, p-values  0.00050564 at m/z = 3277.395
  #11, p-values  0.0023184 at m/z = 5033.1774
  #12, p-values  0.022862 at m/z = 2764.2031
  #13, p-values  0.036115 at m/z = 3178.2104
  #14, p-values  0.040747 at m/z = 3307.8312
  #15, p-values  0.04155 at m/z = 5525.5352
  #16, p-values  0.054108 at m/z = 4046.9202
  #17, p-values  0.073913 at m/z = 8090.9843
  #18, p-values  0.12303 at m/z = 6744.2579
  #19, p-values  0.15149 at m/z = 7059.8915
  #20, p-values  0.17526 at m/z = 2967.2566
  #21, p-values  0.1845 at m/z = 4591.731
  #22, p-values  0.20578 at m/z = 3352.5822
  #23, p-values  0.23769 at m/z = 5671.5438
  #24, p-values  0.30781 at m/z = 5438.3043
  #25, p-values  0.31723 at m/z = 6423.0388
  #26, p-values  0.31723 at m/z = 6844.4122
  #27, p-values  0.33142 at m/z = 7566.6528
  #28, p-values  0.3815 at m/z = 4815.43
  #29, p-values  0.43855 at m/z = 5953.9217
  #30, p-values  0.45125 at m/z = 4177.5814
|
