Unsupervised Hierarchical Cluster Analysis
Introduction
Because of its simplicity and ease of interpretation agglomerative unsupervised hierarchical cluster analysis (UHCA) enjoys great popularity for analysis of microbial mass spectra. Agglomerative UHCA is a method of cluster analysis in which a bottom up approach is used to obtain a hierarchy of clusters. The main idea of UHCA is to organize patterns (spectra) into meaningful or useful groups using some type of similarity measure. The technique belongs to the data-driven (unsupervised) classification techniques which are particularly useful for extracting information from unclassified patterns, or during an exploratory phase of pattern recognition.
In the MicrobeMS implementation hierarchical clustering of mass spectra requires peak tables which should be obtained by means of identical parameters and procedures for spectral pre-processing and peak detection.
See also hierarchical clustering (Wikipedia)
Hierarchical clustering - the algorithm
- First, a distance matrix is calculated which contains information on the similarity of spectra. This matrix is symmetric and of size n x n, where n is the number of spectra. One can choose between four different options to obtain inter-spectral distances: Euclidean distance, Correlation (default method), standardized Euclidean distance and City Block distance.
- Next, the two most similar spectra, that are spectra with the smallest inter-spectral distance, are determined.
- These spectra are combined to form the first cluster object.
- The spectral distances between all remaining spectra and the new object have to be re-calculated. MicrobMS offers five different cluster methods: Ward's algorithm, single linkage, average linkage, complete linkage and centroid linkage.
- A new search for the two most similar objects (spectra or clusters) is initiated. These objects are merged and again, the distance values for the newly formed cluster are determined.
- This procedure is performed n-1 times until only one cluster remains.
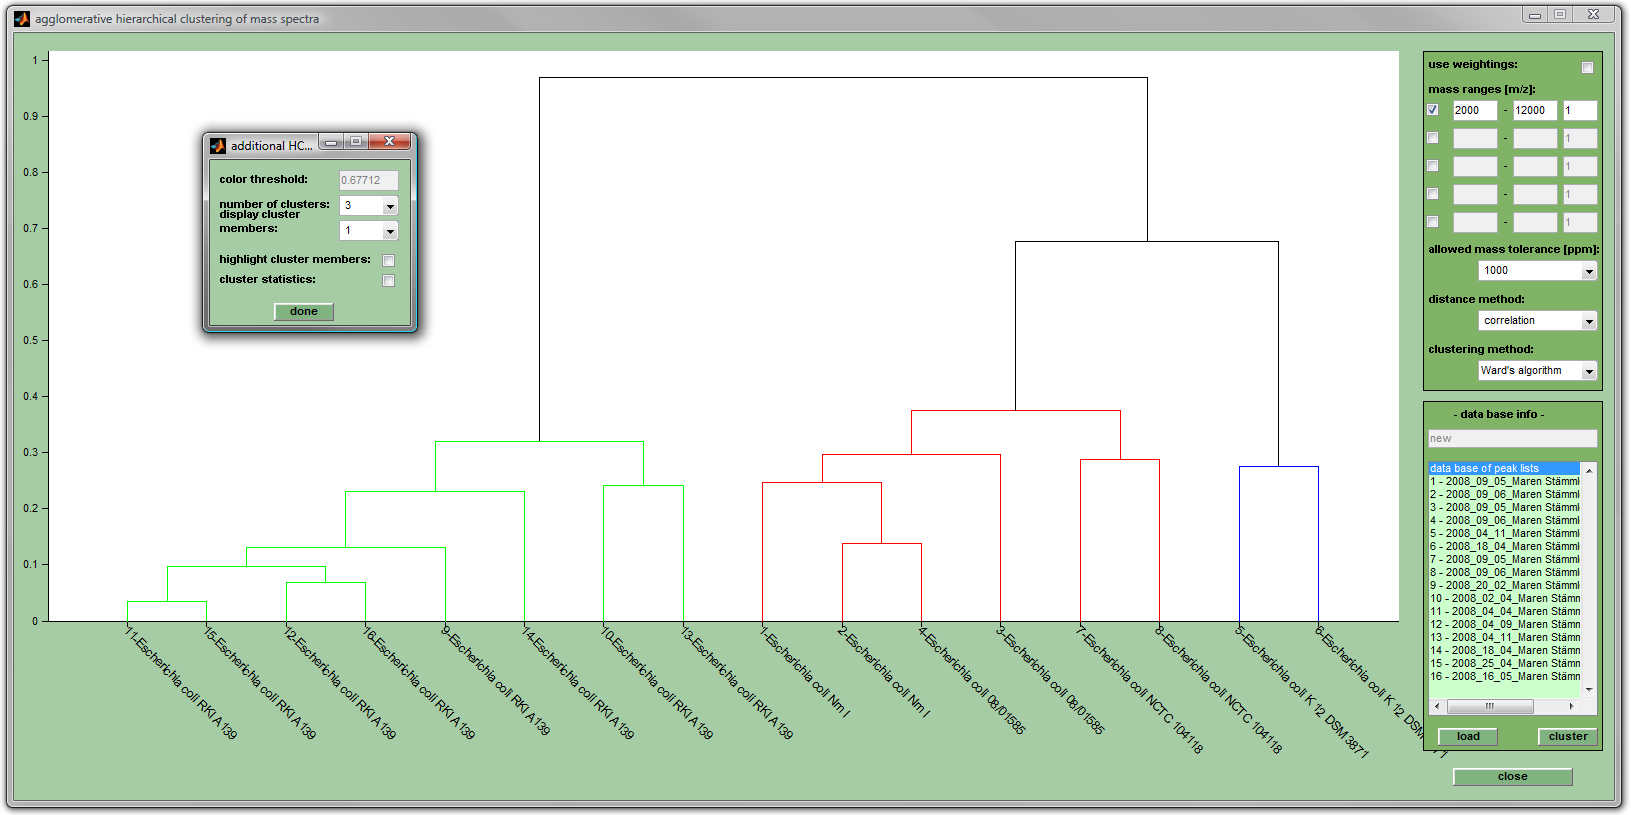
The fusion sequence can be represented as a dendrogram, a tree-like structure which gives a graphical illustration of the similarity of mass spectral fingerprints (see screenshot below). Hierarchical clustering has been extensively used to produce dendrograms which give useful information on the relatedness of the spectra.
Prerequisites and spectra pre-processing
Cluster analysis of mass spectra requires mass spectral peak tables (minimum number: 3) which should ideally be produced on the basis of standardized parameters of peak detection. For cluster analysis, it is recommended to perform the following sequence of steps:
- Load MALDI-ToF mass spectra: Load spectral data in the Bruker format or Import mass spectral data from mzXML data (Shimadzu/bioMérieux)
- Average mass spectra (optional, cluster analysis can be done with single and/or average spectra)
- Spectral pre-processing: smoothing, baseline correction, normalization, cut, auto-calibration, data reduction
- Peak detection by using standardized parameters (recommendation: set the parameter number of peaks to values between 25 and 50).
- Select the peak tables and create a peak table database: for this, press the button add in the PEAK DATABASE tab, or alternatively select add db entry from the Peak Database menu bar.
- Press then the button hierarch clustering from the ANALYSIS tab, or select hierarchical clustering from the Analysis menu bar.
- Cluster analysis can be performed also from peak table lists stored during earlier MicrobeMS sessions: Open the hierarchical clustering window by pressing the button hierarch clustering from the ANALYSIS tab, or select hierarchical clustering from the Analysis menu bar. The peak table list can be then directly loaded.
Parameters of UHCA
- use weightings: checkbox defining whether peak tables with weighting factors (see format of peak tables) or peak tables with barcode values (only the values of 1 or 0 are allowed) are used as inputs for UHCA.
- mass ranges (m/z): these edit fields allow defining up to five different m/z range windows. Note that only peaks from the indicated regions are considered. Check the appropriate checkbox and indicate an adjustment factor between 0 and 1 (1 - full importance (default), 0 - no importance). Regions must not overlap!
- allowed mass tolerance [ppm]: defines the relative width of mass regions, or intervals, in which spectra are diveded: [M-ppm/2 M+ppm/2], with M being the m/z position of a given interval center and ppm given in parts per million units. Example: if M equals m/z 5000 and ppm is 1000, the resulting interval will cover the following spectral region: [4997.5 - 5002.5] (in m/z units). Only in cases where peaks from distinct spectral measurements fall within the borders of the same m/z interval they are treated as beeing identical.
- distance method: allows to define the type of distance method: Euclidean distance, Correlation (default method), standardized Euclidean distance and City Block distance (also known as Manhattan distance)
- clustering method: Permits to chose between the following methods: Ward's algorithm (default), single linkage, average linkage, complete linkage and centroid linkage.
- database info: shows the content of the actual database of peak tables. The button load allows to load a peak list file (*.pkf) stored during earlier MicrobeMS sessions.
- cluster: UHCA is performed and the dendrogram is displayed when this button has been pressed.
